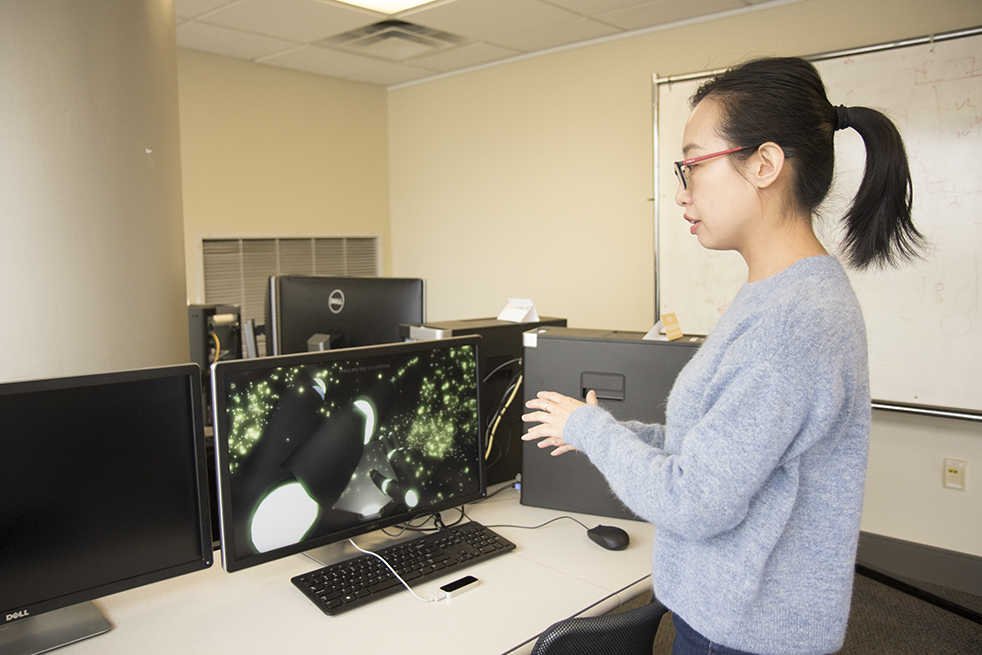
After a soft opening in November, the data visualization lab is up and running.
Located on the first floor of the library, the lab consists of 10 data visualization work stations and two virtual reality stations, one of which comes with an Oculus Rift. The data work stations have multiple programs installed, the vast majority of which are only accessible in the lab.
So, what is data visualization? Ximin Mi, the data visualization librarian, explains it as a way “to show abstract information, either text or numbers, in a more visually understandable way in charts, graphs or other graphics.”
The point is to help people understand information better or compress a lot of information in a relatively small space for visual learning,” Mi continues.
Students may be familiar with all of the construction work and “Pardon our Progress” signs surrounding the library. The work is only one part of Library Next, which began in 2015. Paired with the renovation of buildings is the renovation of services offered by it. The idea is that services will fill the spaces once occupied
by books.
At the start of the project, the library conducted a campus-wide survey to find out what services students would like to have. Data visualization was at the top of
the list.
Mi has seen a great deal of need on campus in the short time the lab has been open.
“There’s really a lot of need for an engineering-heavy campus,” Mi said. “A lot of people want me to come talk to a class or help with a research
project.”
Yet the service is not exclusive to engineering students. Some of the tools, like Tableau, are also usable for students in social science or humanities who may not have a strong tech background. It is a simple drag and drop. Others, like D3, require coding knowledge, making it more ideal to create unique and specific graphics.
The space also includes gaming tools. Unity, a free game design engine, is provided. There is also a hand control tool that can be used for many interactive games available in the lab.
Mi hopes that the games will lead students to something more.
“We want to expose students to all the new technologies and possibilities,” Mi said. “They don’t have to be here for an assignment but I hope that by the time they leave they get something more than just playing a game. Maybe [playing games here] will make them want to take some game design or VR development classes.”
To attain that goal, the lab currently hosts a VR research section, where students are able to complete projects as well as individual research. The class is only in its second semester currently, but already a number of possibilities for the future of the space are being considered.
“My goal is to bring more energy here, to build a community where they can work here and learn from each other,” Mi said.
What Mi and the library have created will serve as more than solely a space for working on assignments and projects, however. The lab will additionally provide a space for teaching to take place.
This semester, the library is hosting 15 workshop sessions teaching multiple data visualization programs, which Tech students are able to register for on the library event calendar page. From 9 a.m. to 5 p.m., an instructor is available in the lab in order to offer assistance, and students may also schedule one-on-one research consultations.
The data visualization lab is a reservation-only space. For more information or to reserve a workstation, visit libguides.gatech.edu/dataviz.